Shrinkage
porosity in forging ingots is another
common defect in steel ingots and one of the reasons, besides
macrosegregation, why the manufacturer has to choose the right
technology to improve the internal soundness of the ingot.
A porosity distribution map may help the technology designer to choose the right casting parameters to avoid shrinkage defects in steel forging ingots. The most employed method to predict the porosity area size and its location is the following Niyama criterion:
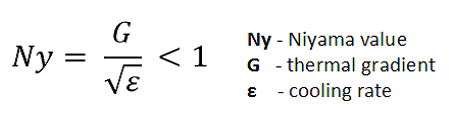
Porosity prediction technique
To predict the porosity area size and its location, we use the Niyama criterion, the most common criterion for porosity prediction in steel ingots. Based on previous relation, we have developed the porosity prediction technique presented in Figure 1 below:
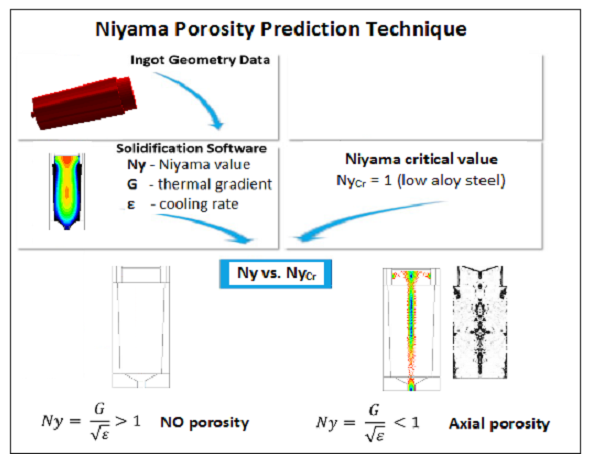
Figure
1 Axial porosity prediction technique
In this figure there
are two branches:
• the left branch which calculates by simulation the temperature gradient and cooling rate has as input data the material properties and ingot geometry taken from ingot mould design software;
• in the the right branch is Niyama critical value (established experimental) at which the porosity occurs; for low alloyed steels this critical value is 1.0.
Then, the analysis software compares the values from both branches and plots the area where shrinkage porosity occurs. Here, there are two situations:
1.In the first case, if the solidification rate is lower than the Ny critical value, there will not be porosity;
2.In the second one, if the solidification rate is bigger than the Ny critical values, the shrinkage porosity occurs.
To quantitatively appreciate the influence of various variables on porosity, we use in solidification analysis the parameter Rp (porosity area ratio), the ratio between area affected by porosity and the longitudinal section of the ingot body.